Customer Experience : Journeys
Features
- It is an administration interface
The journey mode is used to create a map of steps to be taken in interaction with the platform until achieving a goal. Thus, it is possible to measure if a path
is not being convenient enough for the majority of users to abandon it. It can also be measured if the path is being successful.
For example, imagine a hypothetical bank website. On this site, a user opened it on their mobile and clicked on the menu item "Pay bill". Thus, this user
entered the journey of "Payment" through the stage initial "Entered through the main menu". After that, a screen opened with two options,
"Enter Barcode" or "Barcode Reader". In either of these two paths, the goal is to make the payment. Then, the journey ends
when they see the screen with the information "Payment completed successfully". Thus, we have four stages in the "Payment" journey:
- Entered through the main menu - start of journey
- Entering barcode
- Barcode reader
- Payment completed - end of journey
User Manual
To use this feature, it is necessary to register the journey and its stages. Then, register one or more flows in mode
Experience Automation, using action nodes Add user to journey and
Move user in the journey. For example, for the case above, one way to move the user to the last stage is to create an automation flow
that starts with the page view event, with the identifier filter of the page "Payment completed successfully". Then, a node in the flow
Move user in the journey pointing to the last stage of the journey.
To see the users' progress in the journeys, use the journey reports in mode Data Analysis.
There you will obtain reports such as:
- Which stages receive the most users
- Which stages completed successfully the most times
- Which stages are most abandoned
- How many times the journey has been started, completed, or abandoned
- A sankey chart displaying the flow of users overall through the entire journey and its stages
- A chart displaying abandonment progress of the journey over a period
Segmenting users among stages
It is possible to enable in the stage registration the creation of user segmentation. Thus, users who are currently in the same stage will be able to see exclusively the same content published throughout the portal. For example, if a user tried to make the payment by entering the bill code, but gave up returning to the homepage, this user will be for a time in the stage "Entering barcode" - until its expiration. During this time, it is possible to display only to users who are in this stage a banner alerting a new, more convenient payment method.
Screens

Data
Journey
- Name(Short text (string))
Links
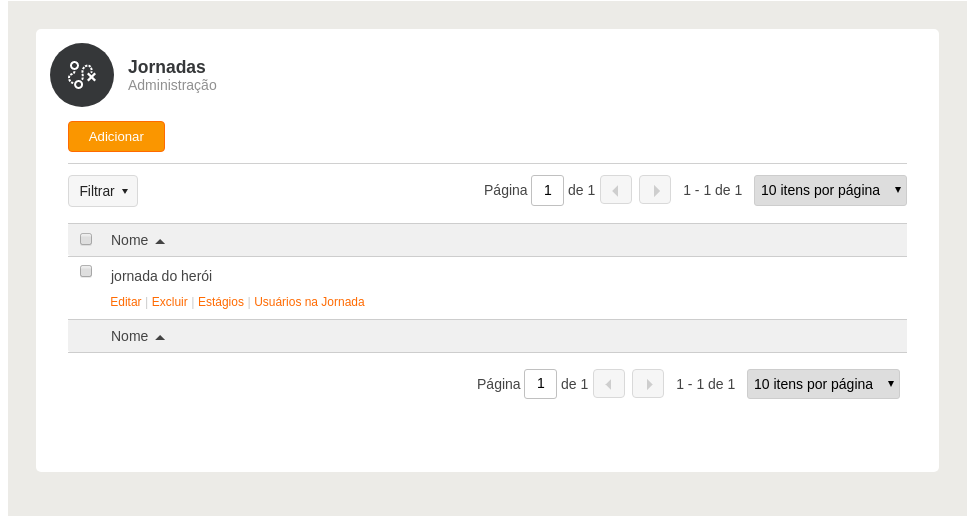
- Add Journey (Add)
- Edit Journey (Edit)
- Stages
- Users in the Journey
Permissions
- Manage User Journeys: Allows access to the User Journeys mode to manage existing journeys.
Actions
- Delete : allows deleting a journey